A huge chunk of your job as a marketer or business owner involves collecting and analyzing data about your target audience to inform business decisions.
All the data you collect falls into one of four categories: nominal data, ordinal data, interval data, and ratio data. Each of these data types is collected and analyzed in different ways.
In this article, we’re focusing on nominal data. You’ll learn:
- What nominal data is
- How to collect and analyze nominal data
- Examples of nominal data and how they’re used in business
- Differences between nominal data and other types of data
What is nominal data?
Nominal data is a type of qualitative data. It can be labeled and grouped into mutually exclusive categories within a variable. These categories do not have any numeric value, are not measured, and cannot be arranged in an order or hierarchy. Since nominal data cannot be ordered, changing the placement of the values will not change the significance of the data.
Sometimes, you may represent nominal variables by numbers, but these numbers don’t have any quantitative impact on the data itself.
Case in point: You’re collecting data from five people on their favorite colors and you get these answers: blue, red, magenta, teal, and yellow. You might decide to assign these color categories a numerical value: 1 to represent blue, 2 for red, 3 for magenta, and so on.
Although you’re using numbers to label each color category, these numbers don’t imply a hierarchy. So teal represented by 4 doesn’t have more value than blue represented by 1 (and vice versa).
How is nominal data different from other types of data?
There are four main types of data:
- Nominal data
- Ordinal data
- Interval data
- Ratio data
These data types fall into two categories: quantitative data (interval data and ratio data) and qualitative data (nominal data and ordinal data). Quantitative data is numbers-based, measurable, countable and subject to most mathematical operators. Qualitative data, on the other hand, is descriptive and helps you understand the what, why, and how behind certain behaviors or choices. Furthermore, descriptive research is an investigatory model which stands out with its unique ability to combine quantitative and qualitative research approaches.
That being said, both nominal and ordinal data are qualitative data that can be gathered by surveys and assessments. The difference is that ordinal data can be measured and arranged in an order. You can also scrape Google to get additional information for your analysis.
Nominal data are usually nouns, e.g. names of people, nationalities, eye colors, etc. That cannot be quantified or ordered. Ordinal data usually measure emotions, such as happiness, satisfaction, and anger in terms of likelihood. This type of data is used in things like the Net Promoter Score (NPS).
Take for example, the question: “How likely are you to recommend our product to your friends?”

Notice how the options can’t be measured, but exist in a specific order that will look weird if the values are scrambled. A business owner can’t define just how much Neutral differs from Unlikely. But they know that, by order of degree, Neutral is a better option for people to choose than Unlikely.
5 examples of nominal data
1. Demographic survey
Demographic information helps you better understand the granular characteristics of your target audience, whether it’s their age, sex, nationality, race, income, marital status, or religion. When you ask demographic-based survey questions, you can gather this data about existing and potential customers on a large scale. This helps you tailor your marketing strategy to appeal to the group of people that are most likely to buy your product or need your services.
Imagine how much more effective your marketing efforts will be if you knew that most people in your target audience are single moms who work a 9-5 job and run a side hustle at the same time, rather than newly married women in a high-income bracket. Or what if you were targeting middle-aged women who lived sedentary lives instead of women in their mid-30s who hit the gym 3-4 times a week?
Knowing the demographic of your target audience can help you:
- Develop trending products or offer the right services
- Measure ad effectiveness
- Identify trends and new business opportunities in your industry
- Understand public opinion about your brand
Collecting demographic data is also beneficial when hiring or recruiting people to work with you. It helps you ensure that your workforce is diverse, equitable, and inclusive.
2. Business assessment
A business assessment is a transparent analysis of your business’ key performance indicators (KPIs) that is designed to show you where your business is at, new business opportunities, factors that are hindering growth, and strategies that can help you achieve the goals you haven’t achieved yet.
Conducting regular business assessments is advised because it helps you:
- Identify gaps in your business strategy
- Understand how healthy (or unhealthy) your business is
- Make informed decisions on where to invest your time and resources
- Know the areas where your business can improve
- Strengthen your relationship with customers, employees, and key stakeholders
- Achieve long-term growth and success
3. Service and hospitality feedback
Customer feedback is the lifeline of every successful business—especially in the service and hospitality industry, where customer reviews directly impact whether a person would visit the business or not.
Without satisfied customers, hotels and restaurants cannot grow. That’s why it’s important that business owners in this industry start to gather customer feedback early on, so they can have an idea of what people think of their establishment and have the opportunity to implement improvements where needed.
In fact, OpenTable’s February 2023 Diner Insights Report shows that 92% of people read restaurant reviews before checking out a new spotl—and they do this before looking at the menu or getting directions to the restaurant.

The best way to ask for guest feedback is to send out simple satisfaction surveys asking your customers about the quality of your service, what they liked, what they didn’t like, and possibly some ideas to help you improve.
If you get mainly positive feedback, you can post it on your website to help potential customers see that they’ll likely enjoy their experience with you should they decide to stop by. If the opposite is the case, you’ll be able to resolve the problems that people complained about and provide a better customer experience. To help you manage this feedback effectively, consider using a customer support ticketing system like Freshdesk or Zendesk. Both are popular options with pros and cons to consider depending on your specific needs.
Make sure to add open-ended questions in your restaurant survey to give respondents the freedom to elaborate or to speak their mind. It adds value to your qualitative customer service research.
4. Voting behavior
If you play app games or use different apps, chances are you have been asked in-app or via email to vote on a feature that the game or app developers are thinking of rolling out.
Product marketers use feature voting to get information about what their users want to see in product updates. Getting feedback directly from your users can help you:
- Build features that users will actually use
- Stick to your development budget
- Manage your customers’ expectations by showing them what you’re working on
5. Personality assessments
Have you ever taken a Buzzfeed-like personality test in which you’re asked questions like:
- Which Harry Potter house would you belong to?
- What genre of books is your favorite?
- What’s your favorite pet?
If you have, then you know that personality assessments can be fun. They can also be invaluable to your business if professionalized.
Personality assessments show your customers that interacting with you is fun and easy. It shows them that you’re interested in learning more about them. And in the process of answering the questions, your customers are able to discover themselves and understand why they make the decisions they do.
The appeal of personality assessments as they relate to business is that it helps you craft unique pieces of content for each personality type or buyer persona. You can offer up this content for download at the end of the assessment or send it via email. This opens up a dialogue between you and the customer. Furthermore, you get contact details like names and email addresses in exchange for the added value you offer through the assessment feedback. To ensure the quality of your list, use an email verification tool to verify the email addresses. Your sales team will thank you for these highly qualified leads.
Knowing your audience’s personalities also helps you create offers and events that are just right for them. For example, an introverted customer might not want to attend a physical event you’re holding, but they may be down to attend a webinar.
How to collect nominal data
Nominal data is usually collected via surveys or questionnaires, often sent our via a cold email marketing campaign. These surveys contain open-ended, multiple-choice, or yes/no questions.
- Open-ended questions give the respondents the freedom to describe their opinions or thoughts in their own words without any restrictions. For example, ‘What do you like about living in New York?’ is an open-ended survey question. The answer will likely differ with each respondent, but you’ll be able to get a wide variety of insights that can inform your decision-making.

Multiple-choice questions are set up so that respondents can choose between options. A great example is this seafood illustration: If you had to choose one of these seafood dishes to order in a restaurant, which would you pick?
- Curried scallops
- Crab cakes
- Paella
- Shrimp scampi
- Fish tacos
This format helps you get specific answers that directly affect your decisions, which facilitates your job in data analytics. Multiple choice questions are easier to pour into an analysis report than open-ended questions.
Yes/No questions are simply questions that require a Yes or No answer. For example, Are you over the age of 18? is a Yes/No question.
How to analyze nominal data
Because it has no numerical value and cannot be put in an order, nominal data can get messy—especially when you’re collecting the data from a large group of people. Fortunately, there are ways to analyze and make sense of nominal data. They include:
- Descriptive statistics
- Data visualization
- Non-parametric statistical analysis
Descriptive statistics
Descriptive statistics are informational coefficients that summarize a dataset found in a study.
A dataset is a compilation of responses and observations from the entire population or a sample of the population. Descriptive statistics describe the features of a dataset and make it easier to understand.
There are three main types of descriptive statistics:
- Frequency distribution
- Central tendency (mean, median, and mode)
- Variability (standard deviation, minimum and maximum variables, variance, kurtosis, and skewness)
For nominal data, you can only use frequency distribution and central tendency (mode only) to analyze nominal data. You can’t use variability because nominal data isn’t quantitative and not subject to mathematical operators.
Frequency distribution
Picture this: You’re planning to open a new seafood restaurant and you’re making your food menu. You have five food choices: curried scallops, crab cakes, paella, shrimp scampi, and fish tacos. So you ask 15 people to tell you which food they’d pick if they had to choose just one.
After gathering their responses, you might notice that the data is disorganized and there’s no way to see how many people picked a specific dish over the others.
To analyze this data, you’ll need to create a frequency distribution table that allows you to see how many responses you get for each food category. A great way to do this in Excel or Sheets is to create a frequency distribution table:

Another example: A marketing consultant wants to learn more about the online presence maturity of her audience. She creates an online presence assessment and waits for the responses to flow in.
The results in this survey dashboard immediately show her how many responses each value has received. She can even choose how the frequency is represented: in absolute or relative numbers, in the form of a bar chart, pie chart, … More on that later.

Central tendency (mode)
Central tendency deals with the average value of a dataset. There are three ways to measure central tendency:
- Mode: The value that appears most frequently in the dataset
- Median: The middle or center value of the dataset
- Mean: The average value of the dataset
With nominal data, you can only use mode to measure central tendency. To identify the mode, look for the category that appears most in your frequency distribution table. In our example dataset, shrimp scampi has the most responses (6 out of 15 people, or 40%). This makes shrimp scampi the mode of the dataset.
Data visualization
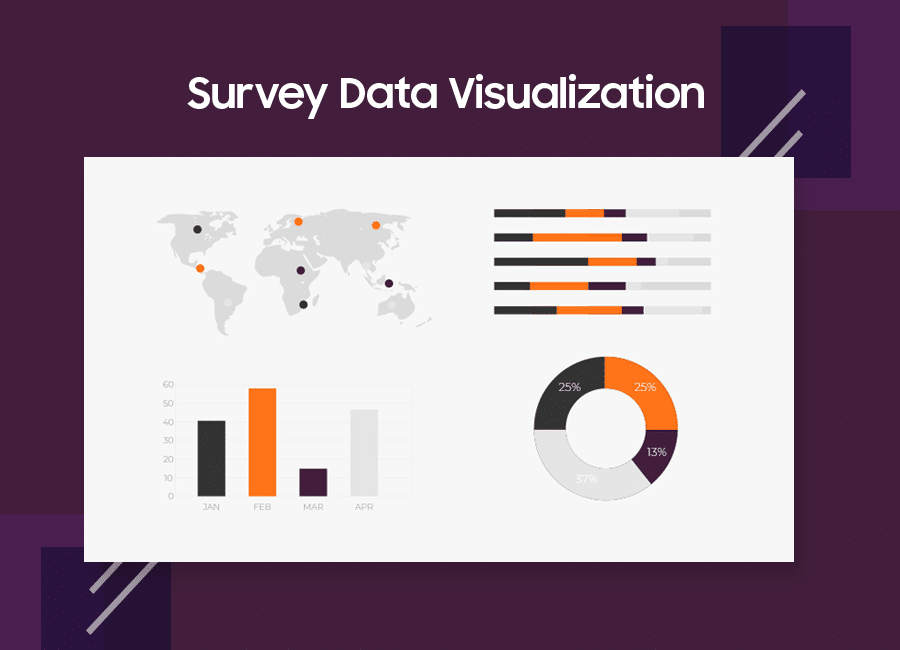
Data visualization is the representation of a dataset in the form of a chart, diagram, graph, or map. Visualizing and transforming your data can help you see data trends, patterns, and outliers easily.
Column charts and pie chart designs are the go-to way of visualizing data. You can create them in Excel or Sheets by clicking Insert and selecting Chart from the menu. With a survey app, generating visual representations is automated for you.


Non-parametric statistical analysis
Descriptive statistics and data visualization only summarize nominal data. Statistical tests, on the other hand, allow you to test a hypothesis based on the data you’ve collected.
There are two types of statistical tests:
- Parametric tests: These are used for quantifiable data (e.g. interval and ratio data, which we’ll discuss later)
- Non-parametric tests: These are used for qualitative data (e.g. nominal and ordinal data)
Since we’re working with nominal data, we’ll use non-parametric statistical tests. There are two types of non-parametric statistical tests:
Chi-square goodness of fit test
If you’re analyzing a dataset with only one nominal variable, the Chi-square goodness of fit test will help you evaluate if your dataset is representative of the whole population.
Let’s use our seafood restaurant example. Imagine that, prior to sending out the survey, you found an official report that showed that most people in your state or country who eat seafood will pick a paella out of all five dishes. But your dataset showed that people preferred shrimp scampi in general.
Since it’s not possible to gather data from everyone in your state, you can use the Chi-square goodness of fit to know how applicable your findings are to the population of seafood-eating people living in your state or country.
Chi-square test of independence
If your dataset has two nominal variables, you can use the Chi-square test of independence (or Chi-square association test) to explore the relationship between both variables.
For instance, say you wanted to find out if there’s a significant correlation between your respondents’ possible allergies and the seafood dish they chose. You’d have to carry out a Chi-square test of independence to compare the frequency of each food choice across the categories of the second nominal variable allergies.
Collect nominal data in assessments with Pointerpro
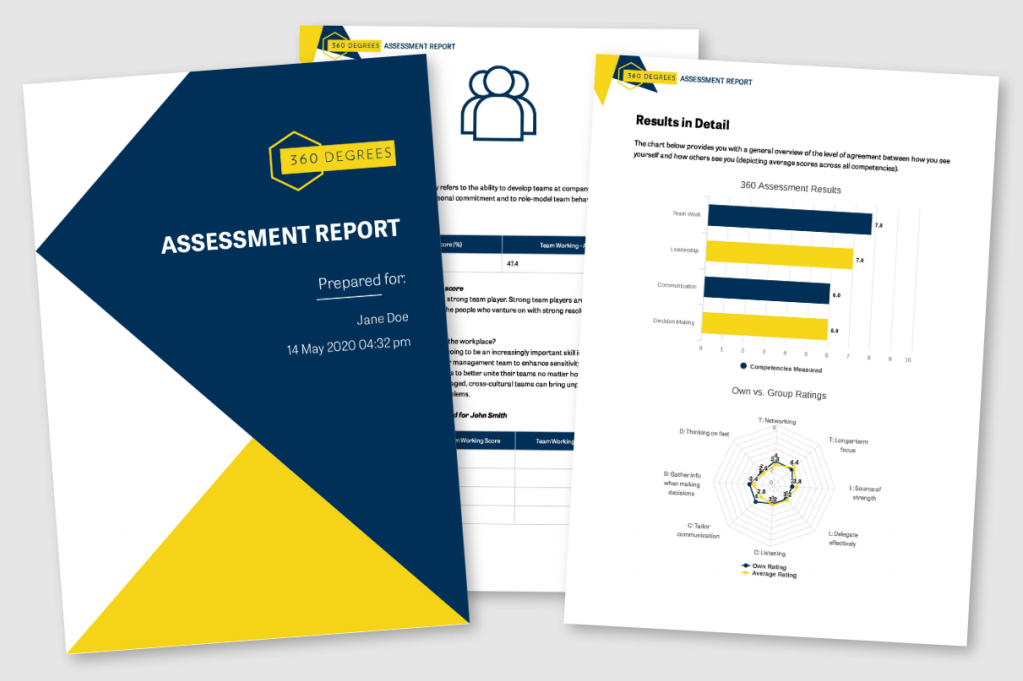
While regular form builders are okay for creating online surveys, you’ll need a specialized assessment tool if you want to send personalized reports to respondents based on their answers.
That’s where Pointerpro comes in.
Pointerpro helps you create custom online surveys and assessments to gather info from your target audience. Once you’ve collected the data, you can put it in an auto-generated report that contains personalized advice or content for every respondent. Interested? Start a free trial.


