How to deliver assessment reports at scale with personalized and consistent recommendations? – 5 key mechanisms (no code needed)

Written September 23, 2025, by Jeroen De Rore

The short answer is what we at Pointerpro call: “auto-personalization,” a wholesome combo of automation and personalization. It implies digitizing your assessments (your questionnaires) and reports, and connecting both together. We’ll get into five strategic approaches below. But first let’s lay out the problem more explicitly: the risk behind scaling your assessment methodology.

What are the risks behind scaling assessments and professional advice?

Here’s the dilemma for consultancy and advisory firms in any domain: a manual, one-to-one approach leads to fully personalized feedback for their clients, but at scale the approach becomes unsustainable and the feedback becomes inconsistent. 

When different consultants interpret the same data, recommendations vary wildly. Where one expert would call for measures A, B and C, another reports that combining A, D and E is the way to go. The result? Your brand promise becomes unreliable.
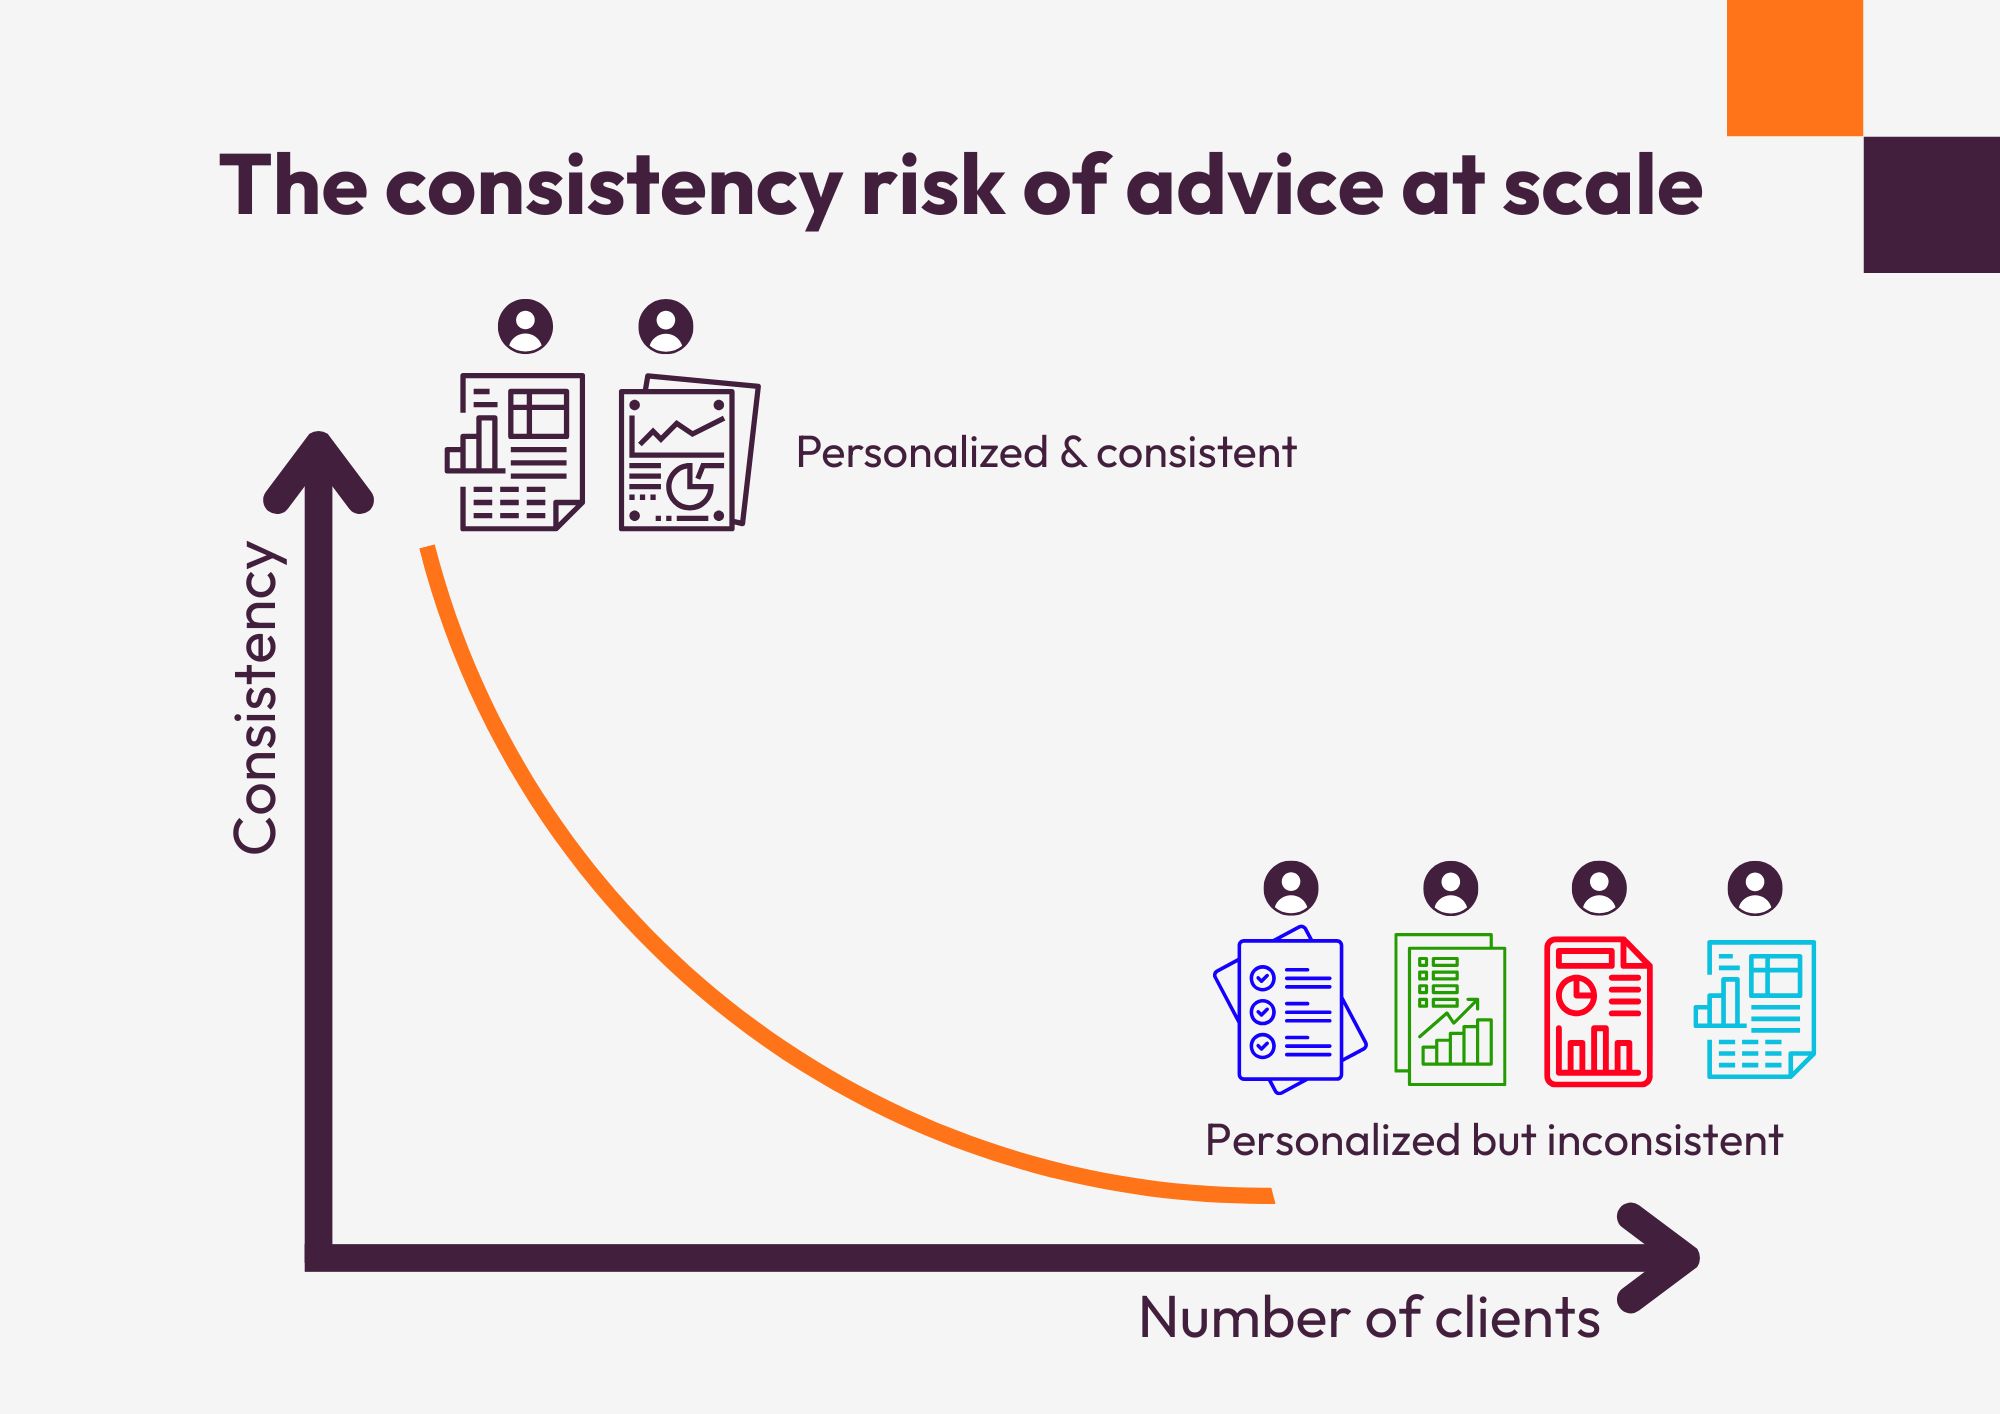
The consistency risk of advice at scale

Nonetheless, personalization is crucial for success.

What’s the cost of not personalizing assessment reports?

Descriptive, one-size-fits-all assessment reports might contain accurate data, but they’re not tailored or actionable to the person receiving them. They solve the consistency problem but they create a set of other problems:

  • bullet orange 150x150 1

    The interaction problem: Research from McKinsey shows that 76% of consumers get frustrated when companies don’t deliver personalized interactions, and this directly impacts engagement. And this research refers to consumers in general, so you can imagine what this means for professional services clients.

  • bullet orange 150x150 1

    The engagement problem: Meanwhile, Nielsen Norman Group research indicates users spend only 4.4 seconds more for each additional 100 words, whereas average reading speed is closer to 200-250 words per minute. That means a reader can really only process about 18 words in those 4.4 extra seconds. In other words, a generic report, no matter how well-written, often gets skimmed or ignored entirely.

  • bullet orange 150x150 1

    The credibility gap problem: When someone receives feedback that could apply to anyone, they question whether the assessment truly captured their unique circumstances. This undermines trust in your expertise and methodology.

  • bullet orange 150x150 1

    The action paralysis problem: Generic recommendations often feel overwhelming or irrelevant. Without clear, targeted next steps, even motivated respondents struggle to act on their results.

The risk of scaling assessment reports

What are the different levels of assessment report personalization?

At Pointerpro, we see new assessment report templates being built every day. We tend to see three levels of personalization, depending on the use cases (the number of questionnaires and reports users can create is unlimited).

Level 1: Basic customization

This is where personalization starts: adding the respondent’s name, company, and assessment date. It doesn’t change the substance of the report, but it makes the recipient feel recognized. Think of it as the “minimum viable personalization” if you want to improve response rates.

  • bullet orange 150x150 1

    Typical use cases: Event-based assessments, such as a post-workshop survey or a quick knowledge check, where speed and acknowledgment matter more than depth.

Level 2: Content adaptation

At this level, explanations and recommendations shift depending on who the respondent is or how they answer isolated key questions

For example, managers might see more leadership-focused content in a personality assessment report than other participants. This requires planning multiple content paths and is usually manageable when dealing with smaller volumes or niche audiences.

  • bullet orange 150x150 1

    Typical use case: HR departments running career development assessments, or consultants tailoring reports for a few dozen clients per year.

Level 3: Dynamic intelligence

Here’s where true “auto-personalization” happens. The report doesn’t just change based on isolated answers. It dynamically adapts to patterns, scores, and complex response combinations. 

The result: highly tailored, actionable recommendations that still remain consistent across large volumes of respondents. This used to require significant technical expertise or countless hours of coding. Today, thanks to some key features for dynamic recommendations, an assessment tool can get you there (at a much lower cost).

  • bullet orange 150x150 1

    Typical use case: Consulting firms for whom assessments are part of their business model: either because they use it for lead generation to impress and attract clients for their consultancy services, or because they monetize the assessments and reports themselves. Many of them combine both approaches.

Steve Howe headshot V3 uai 720x720 1 150x150 1

The wonderful news is that the level of personalization you can reach, even when delivering assessments and reports at a big scale, is very high. No hiring developers or coding is needed.  

So, let’s make it concrete and look at the mechanisms you can use to attain these different levels with Pointerpro.

What are the key no-code mechanisms to personalized assessment reports?

1. The outcome-based mechanism

This approach assigns respondents to predefined categories based on their responses and delivers distinct content for each category. Think of it as creating profiles: each respondent falls into one group, and the report adapts accordingly.

How it works:

  • bullet orange 150x150 1

    Step 1: Add qualifying questions to your questionnaire that determine the respondent’s category. For example, you might ask “What is your hierarchy in the organization?” (with options like divisional director, department manager, team manager) and “How long have you been in this position?”

  • bullet orange 150x150 1

    Step 2: Use Pointerpro’s Outcomes feature to define the answer conditions for each category. For instance, someone who answers “Divisional director” and “10+ years” might fall under “experienced director,” while “Team manager” with “< 2 years” becomes “inexperienced manager.”

  • bullet orange 150x150 1

    Step 3: In the Report Builder, set up sections or pages that correspond to each outcome. When a respondent completes the questionnaire, Pointerpro automatically detects their category and generates a report version that includes only the content linked to that outcome.

Best fit for personalization level 2: Content adaptation. Outcomes can also be determined by scores, but typically they’re used to adapt content more globally – at the level of sections, narratives, or even the entire report – rather than fine-tuning every paragraph or visual.

  • bullet orange 150x150 1

    Pros: Clear and intuitive for respondents; straightforward to implement; engaging starting point in a consultancy journey.

  • bullet orange 150x150 1

    Cons: Content is tailored to a profile but remains relatively broad, without drilling down into specific strengths or weaknesses.

2. The score-based mechanism

Where outcome-based personalization tends to be used for grouping respondents into broad categories, the score-based mechanism personalizes at the level of specific dimensions or competencies.

Rather than assigning someone to a profile, it analyzes their responses in different areas and tailors content accordingly.

How it works:

  • bullet orange 150x150 1

    Step 1: Assign numerical scores to question blocks or individual items (e.g., potential scores of 1 to 5 for answer options on questions about leadership, communication, or problem-solving).

  • bullet orange 150x150 1

    Step 2: Define score thresholds – such as low, medium, high – for each dimension. These thresholds can trigger different text blocks, visuals, or recommendations in the report.

  • bullet orange 150x150 1

    Step 3: In the Report Builder, link specific content to each threshold. A respondent scoring “low” in emotional intelligence might see a “quick wins” improvement plan, while a “high” scorer might receive advanced mentoring suggestions.

Best fit for personalization levels 2–3: From content adaptation to dynamic intelligence. Score-based personalization makes reports more granular and actionable than outcomes, while still being scalable.

  • bullet orange 150x150 1

    Pros: Highly relevant to the respondent’s actual performance; easy to explain (everyone understands “low vs. high”); scales efficiently to large groups

  • bullet orange 150x150 1

    Cons: Requires careful threshold setting; may oversimplify patterns if used without formulas or layered mechanisms

3. The formula-based mechanism

While the score-based mechanism looks at individual dimensions in isolation (low, medium, high), the formula-based mechanism goes a step further. It combines multiple variables – often with different weights – into composite or calculated scores. This makes it possible to reflect how different factors interact in real life, instead of treating them as separate silos.

How it works:

  • bullet orange 150x150 1

    Step 1: Define formulas that combine scores or answers across multiple question groups. For example, you might calculate a “wellbeing index” that weighs stress level at 40%, job satisfaction at 30%, and work-life balance at 30%.

  • bullet orange 150x150 1

    Step 2: Use these formulas as intrinsically variable content inside the Report Builder by displaying their result in KPI widgets as a clear score or percentage, or by visualizing it in charts for an intuitive overview.

  • bullet orange 150x150 1

    Step 3: Apply widget logic rules to any report content to determine which recommendations, sections, or visuals appear in the report. For example, a high wellbeing index could trigger advanced growth strategies, while a low index unlocks targeted support advice.

Best fit for personalization level 3: Dynamic intelligence. Unlike outcome-based or score-based mechanisms, formula-based personalization can capture the interaction effect between variables – something a simple “low vs. high” score cannot do.

  • bullet orange 150x150 1

    Pros: Captures complexity; can reflect interdependencies; provides more precise and actionable insights.

  • bullet orange 150x150 1

    Cons: More setup and maintenance; harder to communicate logic to some stakeholders; requires validation/testing.

4. The hybrid multi-layer mechanism

The hybrid mechanism blends outcomes, scores, and formulas into one layered personalization logic. Instead of relying on just one approach, it lets you stack them so that high-level categories, detailed scores, and nuanced formulas all work together. 

This is how you get reports that are both globally consistent and individually precise.

How it works:

  • bullet orange 150x150 1

    Step 1: Define multiple personalization methods at once. For example, start with outcomes to categorize respondents into broad profiles, then calculate scores within each profile, and finally use formulas to combine those scores into blended results.

  • bullet orange 150x150 1

    Step 2: In the Report Builder, structure your template in layers. Entire sections can be governed by outcome logic, sub-sections or visuals can be triggered by score thresholds, and advanced recommendations can be unlocked by formulas.

  • bullet orange 150x150 1

    Step 3: Test the combinations thoroughly to make sure respondents see content that is both coherent and relevant, no matter which mix of outcomes, scores, and formulas they fall into. The result is a highly personalized report that still follows a consistent structure across all respondents.

Best fit for personalization level 3: Dynamic intelligence at scale. This mechanism is especially powerful when you’re serving diverse audiences with complex needs, where neither a single outcome nor a single score tells the full story.

  • bullet orange 150x150 1

    Pros: Maximum flexibility and precision; impressive for stakeholders; allows both broad and granular tailoring in one report.

  • bullet orange 150x150 1

    Cons: More complex to design and maintain; requires careful planning and testing to avoid contradictions or information overload.

Example in action: Atlas Point

This financial consultancy designed a “financial virtues assessment” with Pointerpro so that financial advisors generate tailored advice and reports based on a respondent’s behavioral profile.
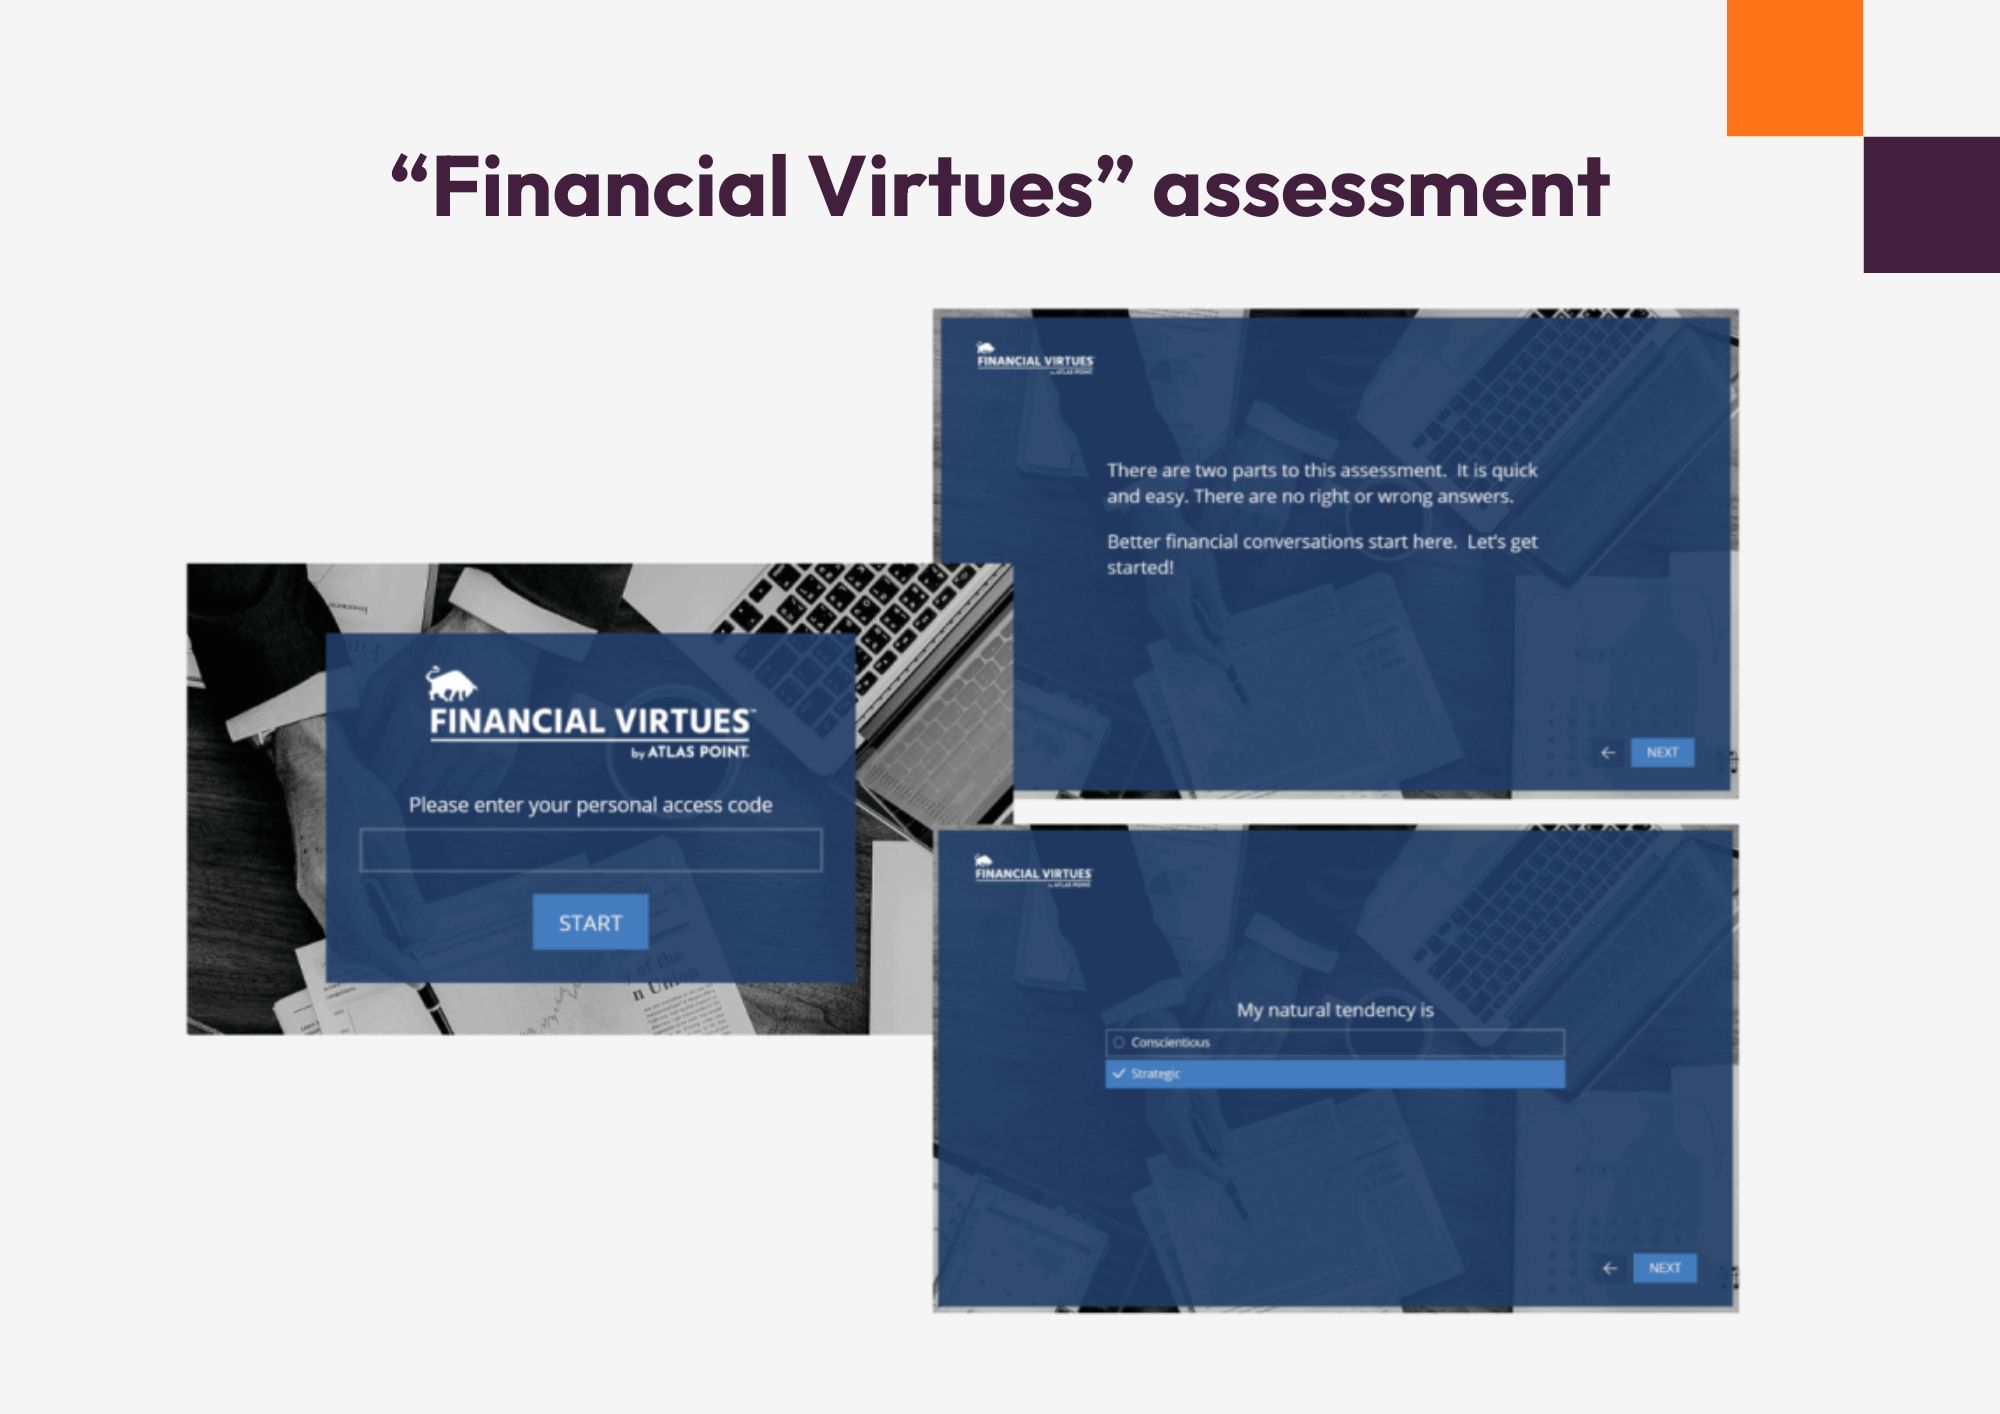
Financial virtues assessment example
Hybrid report personalization mechanism example

5. The progressive disclosure mechanism

Unlike the other mechanisms, which focus on what kind of content to show (categories, scores, formulas), progressive disclosure is about how much content to reveal at once

It delivers the most essential insights first, then progressively reveals more detail only when certain criteria are met. This prevents information overload and ensures respondents focus on what matters most.

How it works:

  • bullet orange 150x150 1

    Step 1: Identify the “core insights” that everyone should see, regardless of their responses. This becomes the starting layer of the report.

  • bullet orange 150x150 1

    Step 2: Define the conditional rules for unlocking additional layers of content. For example, only respondents with high readiness scores or high engagement see advanced strategies, while others stick to the basics.

  • bullet orange 150x150 1

    Step 3: Structure your report so that additional visuals, recommendations, or full sections only appear when those conditions are met. The result is a report that feels streamlined for some and comprehensive for others – without you having to create multiple separate templates.

Best fit for personalization levels 2–3: Content adaptation and dynamic intelligence. Progressive disclosure works especially well for long or complex assessments, where overwhelming respondents with too much information at once would reduce engagement.

  • bullet orange 150x150 1

    Pros: Keeps reports readable; focuses attention on the most relevant insights; prevents information overload while still offering depth when needed.

  • bullet orange 150x150 1

    Cons: Some respondents may wonder why they don’t see as much content as others; requires careful planning of content hierarchy and disclosure rules.

Example in action: Better Minds at Work

In Better Minds at Work’s Human Capital Scan, built with Pointerpro, individual reports show everyone their energy and stress factors upfront, then progressively reveal more detailed visualizations and recommended actions for areas needing attention (e.g. highlighted in red or orange).

Progressive disclosure example

At the organizational level, more advanced layers reveal department-level patterns and deeper analytics.

TL;DR: 5 mechanisms to personalize assessment reports in Pointerpro

Mechanism

Best fit for personalization level

How it works (in brief)

Example in action

Best when you need…

Outcome-based

Level 2: Content adaptation

Respondents are assigned to predefined categories (e.g. profiles). Entire sections of the report adapt to their outcome.

Profiles like “experienced director” vs. “inexperienced manager” → each sees a different report version.

A clear, global adaptation of content per profile.

Score-based

Levels 2–3: From content adaptation to dynamic intelligence

Question blocks or items are scored; thresholds (low, medium, high) determine which recommendations appear.

In leadership assessments, low scorers in emotional intelligence get “quick wins,” high scorers get advanced tips.

Granular tailoring on specific competencies.

Formula-based

Level 3: Dynamic intelligence

Multiple scores are combined (sometimes with weights) into composite results; reports adapt based on these calculations.

Better Minds at Work’s Human Capital Scan combines stress, role clarity, and leadership into wellbeing “battery” visuals.

Capturing interactions between variables for nuanced advice.

Hybrid multi-layer

Level 3: Dynamic intelligence at scale

Combines outcomes, scores, and formulas in layered logic for both global and detailed personalization.

Atlas Point’s financial virtues assessment blends behavioral outcomes with financial logic to guide advisors.

Maximum precision for diverse audiences with complex needs.

Progressive disclosure

Levels 2–3: Content adaptation & dynamic intelligence

Core insights are shown to everyone; advanced detail is revealed only when conditions are met.

Better Minds at Work shows energy/stress factors first, then deeper recommendations and team-level analytics.

Preventing overload while keeping reports engaging and focused.

Riaan van der Merwe Square format

Want to talk more about personalization? 

 
As a copywriter, I believe the power of personalization is what turns generic messages into magnetic conversations. Personalization isn’t just sprinkling someone’s first name into an email. it’s about showing you understand their world. I’m happy to get in touch and discuss how you can not only personalize your assessments with report tailoring mechanisms, but also with language. 


Feel free to connect!

4 common assessment and report personalization mistakes (and how to avoid them)

Even with the right mechanisms in place, it’s possible to misstep when designing personalized assessment reports. Here are the four most common pitfalls we warn Pointerpro users about, when onboarding our platform – and how to avoid them, of course.

Mistake 1: Personalizing the wrong elements

  • bullet orange 150x150 1

    The error: Some consultancies present cosmetic changes as if they were true personalization. For example, a firm might deliver a “strategy readiness report” with the client’s name and logo on the cover, and even drop in variables collected through the questionnaire (such as company location or competitor names).

    But announcing such a report as “tailor-made” while the recommendations inside are identical for every client is dangerous territory. The moment a client realizes this, trust takes a hit. What was sold as bespoke advice is exposed as generic – and credibility suffers.

  • bullet orange 150x150 1

    The fix: Reserve the term “tailor-made” and even “personalized” for reports where the content itself adapts to the client’s situation – not just the surface details. Build personalization around outcomes that segment companies by type (for instance, scale-ups versus corporates) or around score thresholds that trigger different strategic recommendations.

Mistake 2: Over-reaching with personalization too early

  • bullet orange 150x150 1

    The error: Some advisors try to build more complexity into their reports than their underlying assessment model can support. For example, a consultancy designing a business assessment might immediately create multiple variations for answer choices within various domains.

    If they don’t have equally strong expertise and validated metrics for each domain, the result risks feeling irrelevant or it might even undermine credibility. A digital assessment should always be grounded in a solid, specialized quantitative maturity model before branching into extensive personalization.

Overreaching with personalization
  • bullet orange 150x150 1

    The fix: Start by building personalization around the strongest, most validated parts of your assessment model. For instance, if your leadership framework is solidly defined for emerging leaders and experienced managers, begin with those two segments.

    Once you’ve confirmed the model produces reliable insights and actionable recommendations, expand carefully into additional roles or seniority levels. This ensures every variation in the report is backed by expertise and credibility, not just by the mechanics of personalization.

Mistake 3: Ignoring the reader’s context

  • bullet orange 150x150 1

    The error: Personalization sometimes fails because it relies solely on scores, without factoring in the respondent’s situation. Hypothetically, a wellbeing scan might flag high stress for both junior employees and senior managers, then serve everyone the same advice: “delegate more.” For juniors, this advice is irrelevant.

  • bullet orange 150x150 1

    The fix: Add contextual qualifiers such as role, tenure, or objectives to your personalization logic. This ensures juniors receive time-management advice, while managers see delegation strategies – so both groups feel understood. That’s the hybrid multi-layer mechanism we discussed.

Mistake 4: Being personalized but only descriptive

  • bullet orange 150x150 1

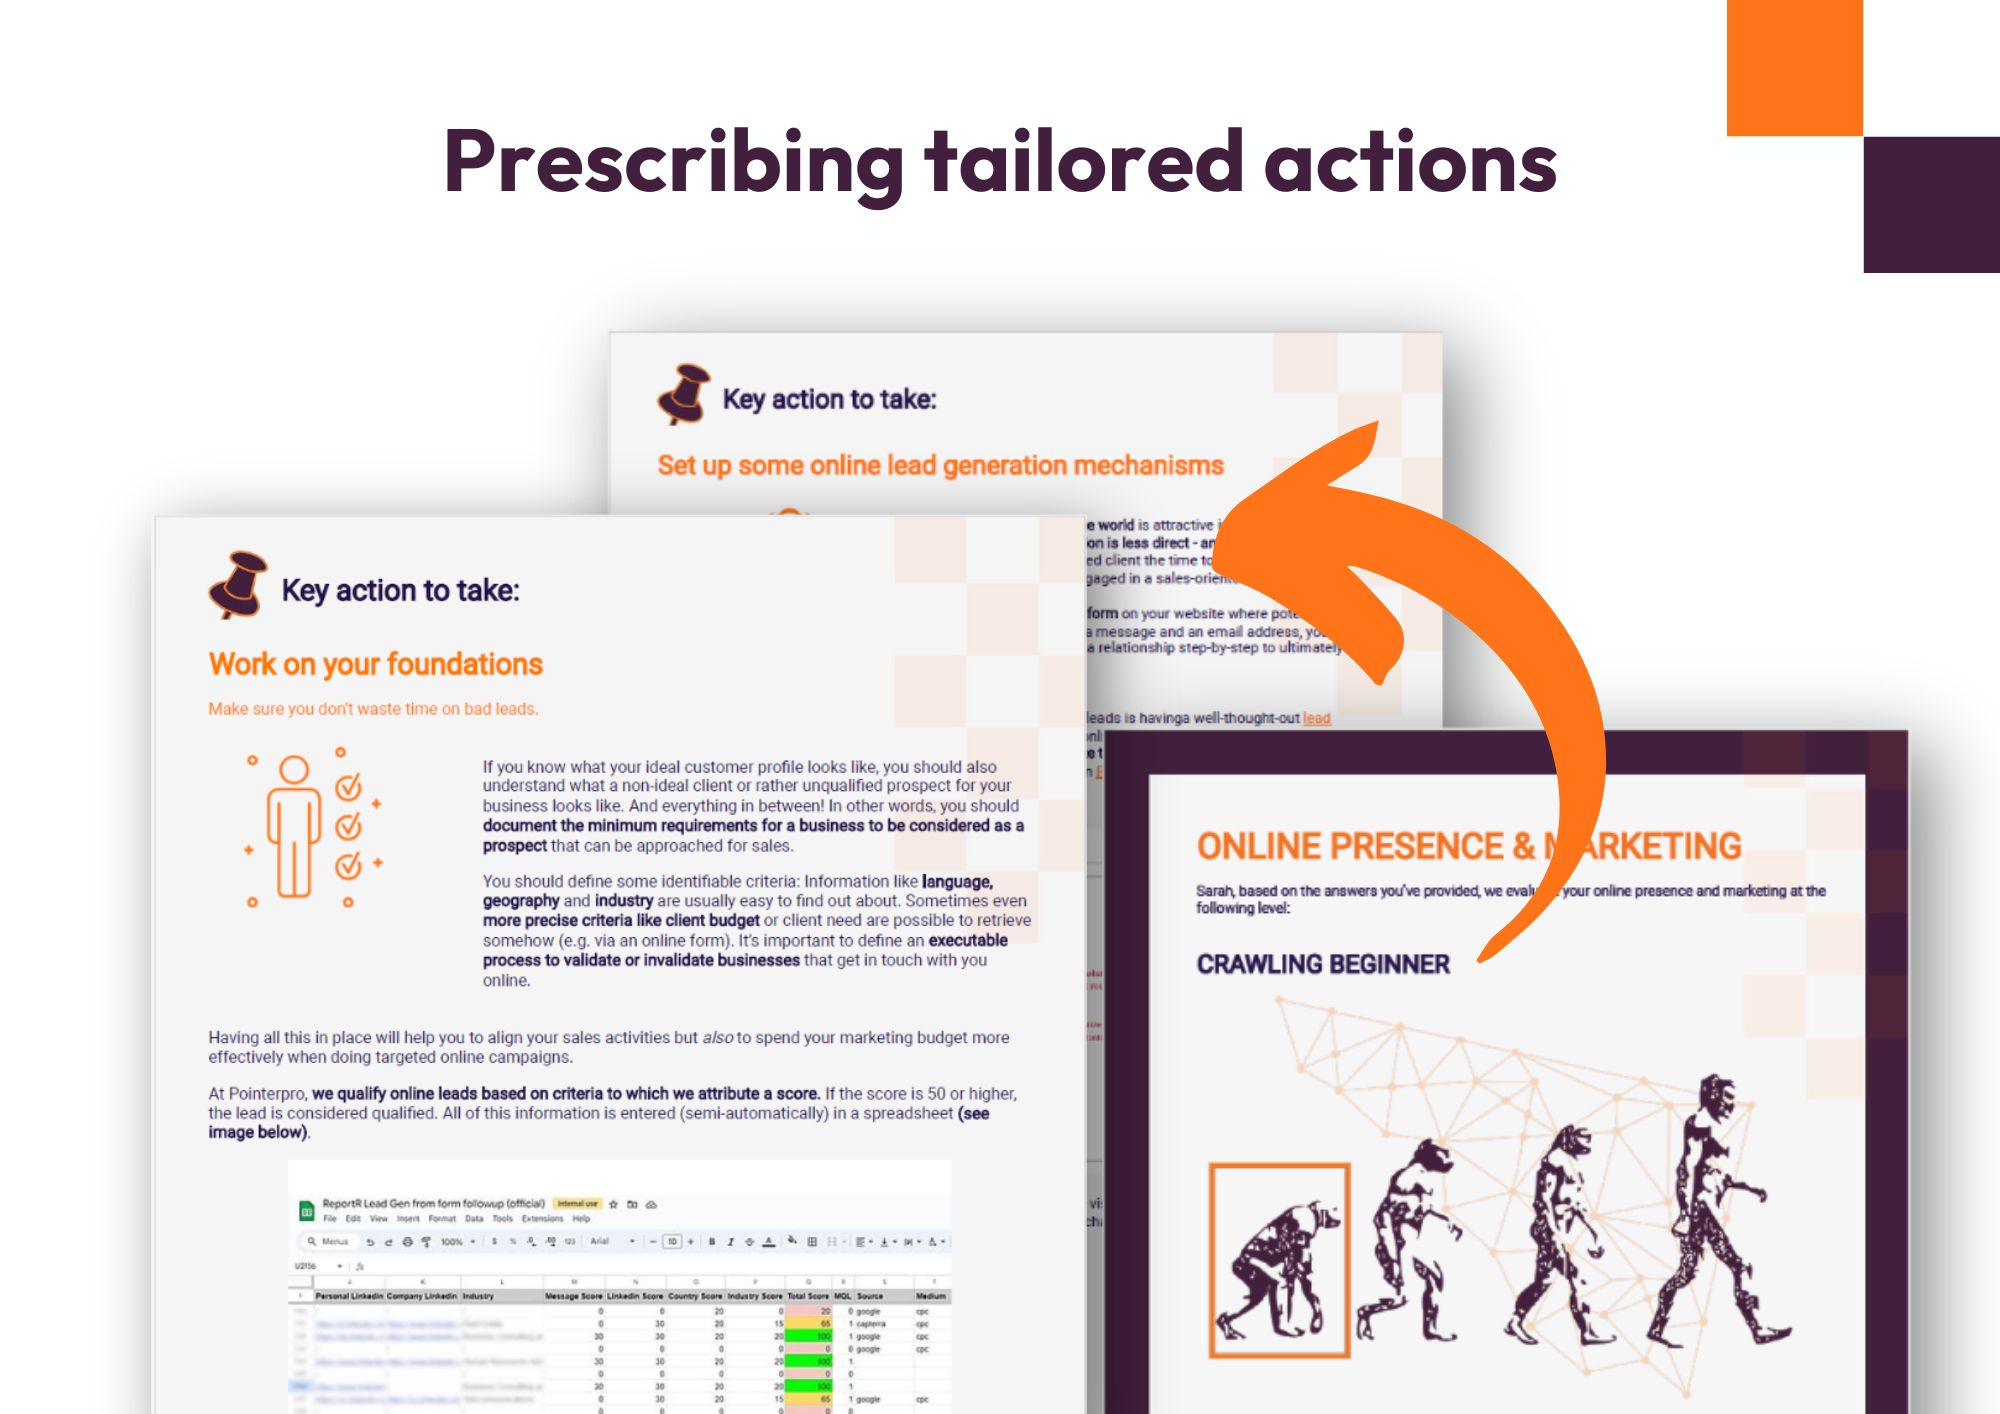
    The error: Too often, assessments stop at descriptive output. Yes, the feedback may be personalized – drawing on scores, formulas, or detailed observations. But if it only describes the respondent’s situation without translating that into clear actions, it still falls short.

    For example, a consultancy might run a digital capability scan that highlights specific strengths and weaknesses, yet fails to provide concrete next steps. Clients quickly sense the gap: “This report tells me about myself, but not what I should actually do with this information.”

Prescribing tailored actions
  • bullet orange 150x150 1

    The fix: Always end personalized sections with clear actions. A stronger approach is: “You’re at level 2 in automation. To reach level 3, start by automating onboarding emails – here are two tools to consider.” This makes the report actionable and reinforces its value.

How do you decide how much personalization to use?

The best personalization approach depends on several factors:

  • bullet orange 150x150 1

    Assessment complexity: Simple assessments with clear categories work well with outcome-based approaches. Complex, multi-dimensional assessments may need formula-based logic.

  • bullet orange 150x150 1

    Volume requirements: Manual personalization works for boutique services but breaks down at scale. High-volume assessments need automated solutions.

  • bullet orange 150x150 1

    Technical resources: Consider both setup requirements and ongoing maintenance. Some approaches need technical expertise; others can be managed by non-technical team members.

  • bullet orange 150x150 1

    Budget constraints: Factor in both technology costs and time investment. Sometimes a simpler approach that you can implement quickly beats a sophisticated solution that takes months to deploy.

  • bullet orange 150x150 1

    Stakeholder expectations: Consider who will be reading these reports and what level of personalization they expect based on your industry and positioning.

Think beyond the report: Personalize each assessment touchpoint

It’s easy to think of personalization as something that only happens inside the report. But every interaction your respondent has with your assessment is part of the experience, and an opportunity to reinforce relevance and consistency.

  • bullet orange 150x150 1

    Tip: The same outcomes, scores, and formulas that drive personalization in the report can (and should) be reused in your emails, questionnaire logic, and final screen. That way, personalization is not just a one-off in the report, but a thread that runs consistently through the entire respondent journey.

Three areas are often overlooked:

1. Personalized emails

The first and last impression often comes by email: the invitation to take the assessment, the reminders, and the result notifications. With Pointerpro you can:

  • bullet orange 150x150 1

    Use editor variables (like name, company, or even answer values) to insert personal details into the text.

  • bullet orange 150x150 1

    Set up different email templates depending on outcomes or scores, so the message aligns with the respondent’s results.

  • bullet orange 150x150 1

    Schedule reminder emails that only go to people who haven’t yet completed the questionnaire.

This ensures that the communication before and after the assessment is just as tailored as the report itself.

2. Adaptive questionnaire paths

Nobody enjoys answering irrelevant questions. That’s why Pointerpro’s question logic feature lets you adapt the path of the questionnaire in real time. You can:

  • bullet orange 150x150 1

    Show or hide questions depending on earlier answers or scores.

  • bullet orange 150x150 1

    Skip respondents directly to the next relevant section or to the end screen if certain conditions are met.

  • bullet orange 150x150 1

    Even combine logic with formulas for more advanced branching.

Rule based question logic
Rule based question logic UX

The result is a smoother experience, higher completion rates, and better-quality data – all before the respondent even sees the report.

3. Personalized final screen

Right after someone completes the questionnaire, the final screen is their first moment of feedback. With Pointerpro you can:

  • bullet orange 150x150 1

    Personalize the text using variables and outcomes, so it reflects the respondent’s input.

  • bullet orange 150x150 1

    Add a chart or KPI widget to give them a visual preview of their results.

  • bullet orange 150x150 1

    Use logic to show different summaries depending on outcomes or scores.

Outcome based personalized final screen

Think of it as a teaser: it delivers immediate value while building anticipation for the full PDF report that follows.

Get started with personalized assessment reports now

Scaling your expertise doesn’t mean sacrificing personalization. With the right mechanisms in place, you can deliver reports that are both consistent and truly tailored – and do it all without writing a single line of code.

That’s exactly what Pointerpro was built for: transforming questionnaires into automatically personalized reports that impress clients, boost engagement, and save you countless hours of manual work.

Ready to see how it works in practice? Book a demo with our team and discover how you can start delivering auto-personalized reports at scale.

Start creating
dynamic assessment reports at scale!

This is what clients say about Pointerpro:​

People also ask

Yes. Pointerpro connects with platforms like HubSpot, Zapier, and Make, allowing you to automate workflows - for example, sending completed report data into your CRM or triggering follow-up emails.

Absolutely. You can fully brand your reports with your logo, fonts, and colors, ensuring every document looks like it comes straight from your consultancy or company department.

Yes. Many consultancies use assessments as gated content: respondents answer a questionnaire, then immediately receive a personalized report. This creates a valuable exchange and helps convert prospects into qualified leads.

Pointerpro is used by consultants, HR leaders, L&D teams, coaches, and advisory firms that want to scale their expertise by digitizing assessments and delivering automated reports.

Recommended Reading

Want to know more?

Subscribe to our newsletter and get hand-picked articles directly to your inbox

Please wait..
Your submission was successful!

About the author:

Jeroen De Rore

As Creative Copywriter at Pointerpro, Jeroen thinks and writes about the challenges professional service providers find on their paths. He is a tech optimist with a taste for nostalgia and storytelling.